Five Types of Architecture Diagrams
Have you ever been in a meeting where someone is trying to explain how a software system works?
I was having a conversation with a relatively new solutions architect who was trying to describe a system they had come up with. It had about eight different components to it and they all interacted with each other in multiple ways.
They were explaining the solution using hand gestures and a lot of “and this piece communicates with this one by…”
I understood the words coming out of their mouth, but they didn’t make sense strung together.
Words get lost when explaining complex conceptual architecture. I was trying to build a mental model while following a train of thought. I needed a visual.
I needed a diagram.
But not just any diagram. Architecture diagrams are not a “one size fits all” solution.
We’ve discussed recently that a significant part of being a solutions architect is effectively communicating your ideas to both technical and non-technical audiences.
Your diagrams must take that into consideration. If you want to get your idea across to different sets of people, you must make multiple versions of your diagrams.
Today, we are going to talk about the five different types of diagrams you should make depending on five different audiences.
We will take an example from my fake business but real API, Gopher Holes Unlimited, where we add a new gopher into the system to be tracked.
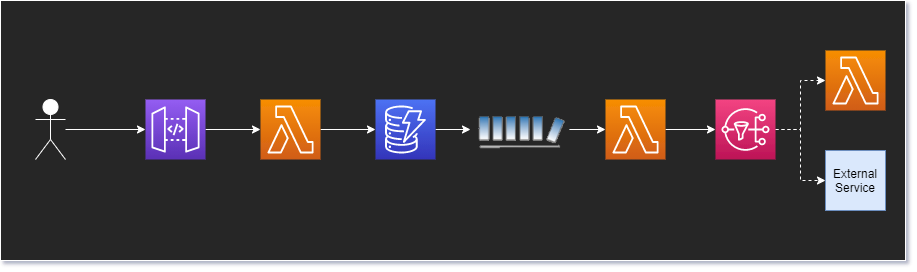
1. The Flow Diagram
The most generic and generally broadest-reaching diagram you can make is the flow diagram. It is a medium- to high-level diagram that shows all the pieces of a workflow.
This diagram illustrates the moving parts in a business process.
Audience
The audience for this type of diagram is generally technical. It may be used to pitch an idea to an architecture board or describe how a business process works to a developer.
Considerations
The major component of the architecture flow diagram is the inclusion of all the moving parts. In the case of our serverless AWS environment, we label each managed service and which ones communicate with each other.
No details on how the pieces interact with each other are described, but the diagram does show the connections. It shows how data flows through the system.
Leave a Reply